
Search engine marketing reporting translates raw numbers from paid and organic campaigns into business insights. It connects clicks, impressions, and cost to strategic goals. This process proves ROI and aligns marketing with company objectives.
Rethinking Your Search Engine marketing reporting
The old way of reporting on search marketing is broken. Focusing on vanity metrics like clicks and keyword rankings fails to show your full impact. A modern approach is needed to prove real business value.
This shift is driven by AI’s growing role in search. Traffic from large language models has surged 527% year-over-year. This change demands a new way to measure performance.
Tools like Google’s AI Overviews are changing the metrics that matter. The conversation is shifting from click-through rates to brand share of voice in AI-generated responses. This requires a new way of thinking.
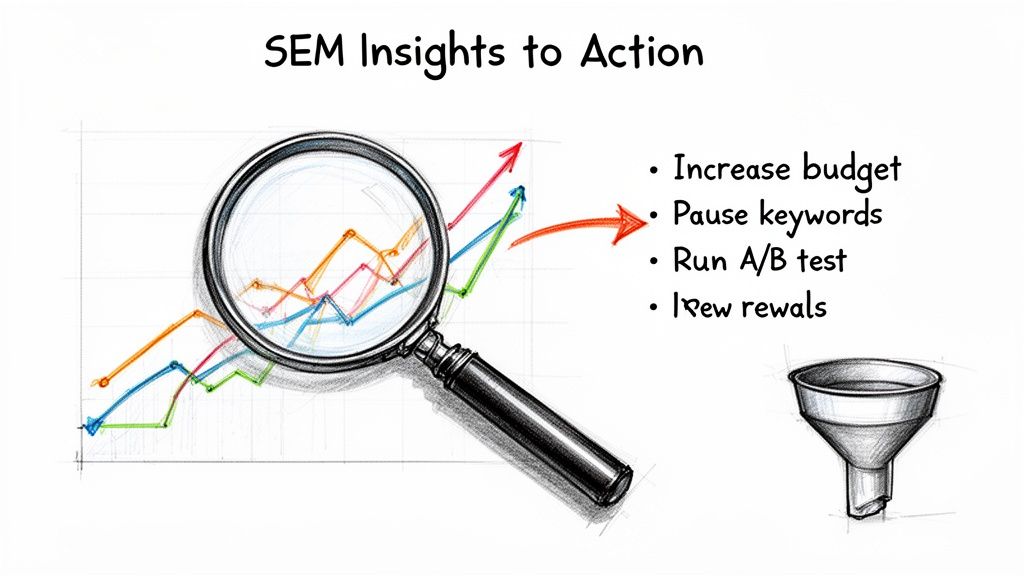
This flowchart maps the transition from outdated metrics to a strategic reporting framework.
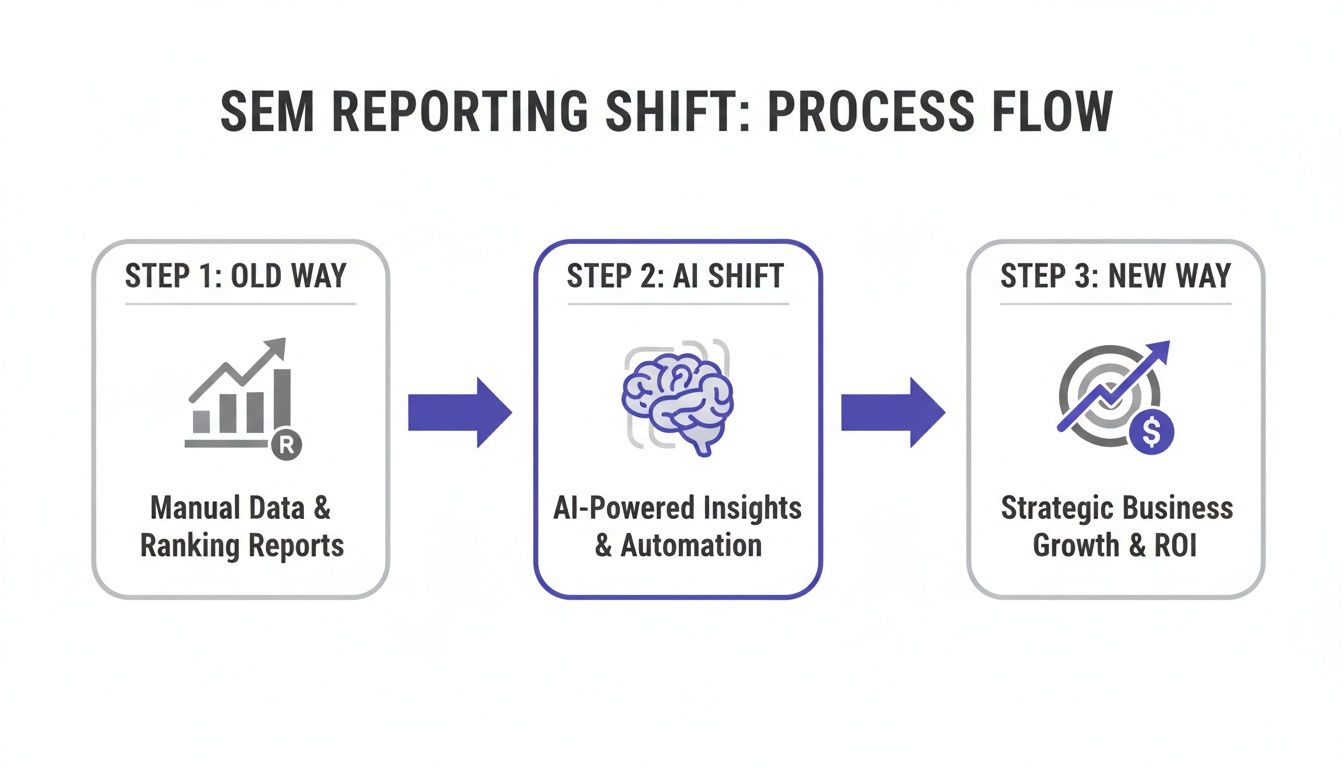
It’s all about connecting SEM campaign activities to tangible business outcomes.
The Shift in SEM Reporting Priorities
Comparing old and new reporting methods highlights this fundamental change. The table below shows the shift from isolated channel metrics to a holistic view.
| Reporting Area | Legacy Metric | Modern KPI |
|---|---|---|
| Visibility | Keyword Rankings | Share of Voice in AI Answers |
| Traffic | Total Clicks | Qualified Lead Volume |
| Engagement | Click-Through Rate (CTR) | Conversion Rate (by segment) |
| Cost | Cost-Per-Click (CPC) | Customer Acquisition Cost (CAC) |
| Value | Impressions | Customer Lifetime Value (CLV) |
The modern approach measures the quality and long-term value of your audience. It prioritizes impact over activity.
Modernizing Your Reporting Framework
Adopt a better PPC report format to drive growth. Your reports must tell a compelling performance story that guides future strategy. You need to move from data dumps to strategic narratives.
An effective SEM reporting framework does three things well:
- Demonstrate Value: Connect campaign activities to business outcomes like revenue.
- Provide Clarity: Make complex data easy for anyone to understand.
- Drive Action: Uncover insights that lead to specific, data-backed optimizations.
The real goal is to turn SEM reporting from a chore into a strategic asset. A great report explains why something happened and what to do next.
This guide provides a practical plan for this transition. Learn how to measure influence and justify your budget when clicks are no longer the only currency. For deeper insights, explore search marketing intelligence.
Connecting SEM Metrics to Business Goals
Great SEM reporting begins by asking, “How does this help the business?” Every click, conversion, and dollar must tie back to a real business objective. Otherwise, you’re just sharing numbers without demonstrating impact.
The first step is to ditch vanity metrics. A mountain of impressions might look nice, but it doesn’t generate revenue. Your reports must focus on Key Performance Indicators (KPIs) that reflect business health.
Defining Your Core SEM KPIs
The right KPIs depend entirely on your business model. An e-commerce brand has different goals than a B2B SaaS company. Your reporting must reflect this distinction by measuring outcomes, not just activity.
Here are a few business-centric KPIs to consider:
- Cost Per Acquisition (CPA): This is your true cost to acquire a new customer. It answers the critical question: “How much are we paying for each new customer?”
- Return On Ad Spend (ROAS): This metric calculates the revenue generated for every dollar spent on ads. A 4:1 ROAS means you make $4 for every $1 spent, measuring campaign profitability.
- Customer Lifetime Value (CLV): CLV predicts the total profit expected from a customer over time. It justifies higher acquisition costs for high-value clients.
Context is everything when choosing metrics. For niche industries, understanding Law Firm PPC KPIs shows how specific sectors track success.
A valuable SEM report answers tough questions from leadership. Stakeholders want to know if their investment is paying off and how marketing fuels the bottom line.
Aligning Metrics with Business Scenarios
The metrics you prioritize depend on your company’s definition of success. Using the right tools also makes a difference. For more, check our guide on enterprise rank tracking software platforms.
For an E-commerce Brand: An online store needs immediate profitability. Reporting should focus on ROAS and Average Order Value (AOV). The goal is simple: ensure every ad dollar spent generates a positive return.
For a B2B SaaS Company: The sales cycle is longer, shifting the focus from instant sales to pipeline quality. Important KPIs become Marketing Qualified Leads (MQLs), CPA, and the lead-to-customer conversion rate.
This tailored approach changes the conversation. You stop saying “we got 10,000 clicks.” You start saying “we generated 50 qualified leads at a $200 CPA,” proving real business value.
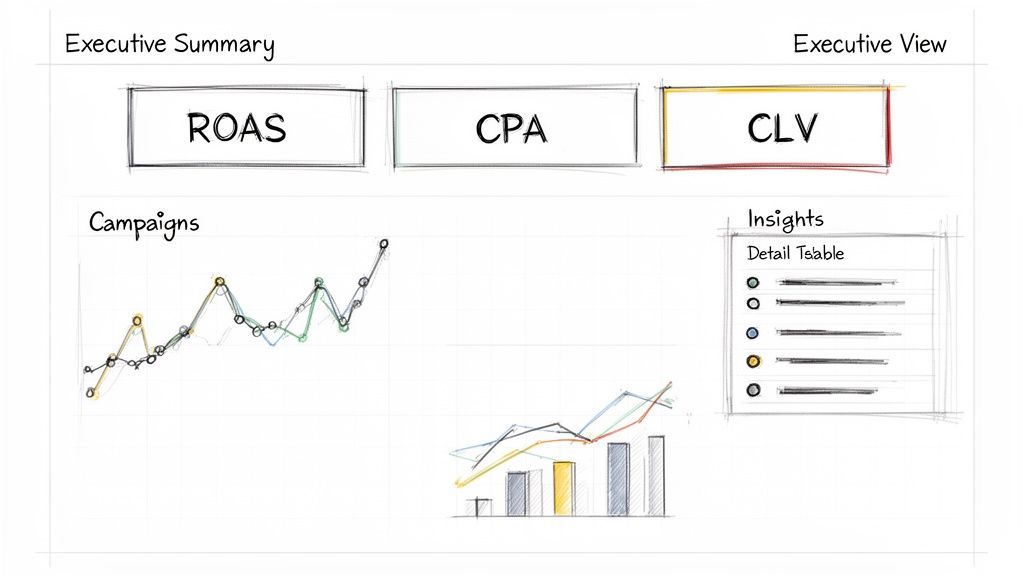
How to Build an Actionable SEM Dashboard
A good SEM dashboard tells a story, not just shows numbers. It should surface insights needed for your next move. The goal is to create clarity at a glance, not a puzzle.
First, pick your tool. Free platforms like Looker Studio are perfect for getting started. They connect directly to Google Ads and GA4, making it easy to pull in core performance data.
For more complex needs, consider business intelligence (BI) platforms like Tableau or Power BI. These tools integrate data from many sources, like CRMs and social media. This allows for a richer, cross-channel view of performance.
Designing for Your Audience
A one-size-fits-all dashboard never works. The metrics a CEO cares about differ from what a campaign manager needs. Tailoring the dashboard to its audience makes it infinitely more useful.
The Executive View (The “So What?” Dashboard) This high-level dashboard answers big business questions quickly. It focuses on bottom-line impact.
- Key Metrics: Focus on ROAS, Customer Acquisition Cost (CAC), and total revenue or leads.
- Visuals: Use large scorecards for main numbers and simple trendlines for growth.
- The Goal: Allow a stakeholder to understand SEM health and ROI in under 60 seconds.
The Campaign Manager View (The “Why?” Dashboard) This deep-dive dashboard is for day-to-day optimization. It helps the team understand why performance is changing.
- Key Metrics: Include CTR, CPC, Conversion Rate, and Quality Score. Break down performance by campaign and ad group.
- Visuals: Use detailed tables to compare campaign performance. Daily fluctuation charts are also essential.
- The Goal: Empower the team to spot issues and make quick, data-backed adjustments.
The best dashboards have a clear visual hierarchy. Put the most critical business KPIs at the top, allowing users to drill down into granular data below.
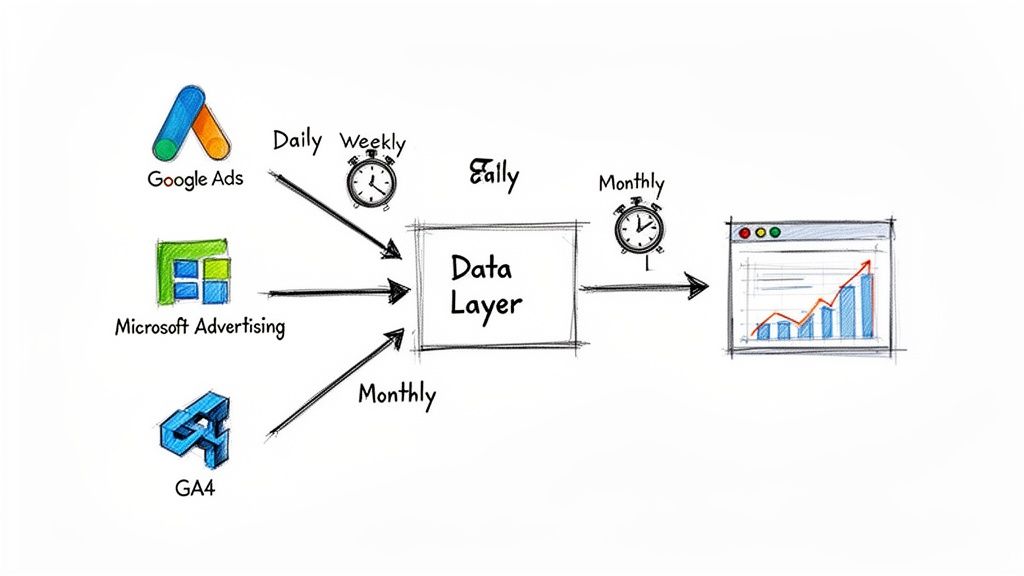
Connecting Your Essential Data Sources
A powerful dashboard creates a single source of truth by pulling data from multiple places. At a minimum, connect your advertising and analytics platforms.
Your essential connections should include:
- Google Ads and Microsoft Advertising: This is your primary source for spend, clicks, and impressions.
- Google Analytics 4 (GA4): This provides the post-click story, like engagement rate and user journeys.
- Your CRM (e.g., Salesforce, HubSpot): This is the game-changer, tying ad spend directly to qualified leads and revenue.
Blending this data lets you talk about business impact, not just platform metrics. It helps answer, “Which campaigns drive our most valuable customers?” Our list of the best SEO ranking and reporting software has more tool ideas.
Automating Your Data and Setting a Reporting Cadence
Manually pulling search engine marketing reports is a time-consuming task. Build automated data pipelines that feed information directly into your dashboards. This eliminates manual work and ensures your data is always current.
Connect APIs from platforms like Google Ads and Microsoft Advertising to a tool like Looker Studio. This creates a live link, letting performance data flow in automatically. This frees you up to focus on strategy instead of spreadsheets.
Establishing a Smart Reporting Rhythm
Knowing when to check reports is as critical as automation. A smart reporting cadence delivers the right information to the right people at the right time. This builds trust and prevents data overload.
Not every metric needs daily monitoring. Match the reporting frequency to the insight you need. This prevents panicked decisions based on normal daily fluctuations.
The goal of a reporting cadence is to create a predictable rhythm for analysis. It separates urgent alerts from important strategic trends.
Your SEM Reporting Cadence
A structured schedule keeps you proactive, not reactive. Different metrics tell different stories over time. Here’s a practical breakdown of what to look at and when.
- Daily Checks (5-10 Minutes): This is a quick health check for critical alerts and budget pacing. Look for disapproved ads or campaigns nearing their budget limit.
- Weekly Reviews (30-60 Minutes): Dig into performance trends here. Analyze week-over-week shifts in ROAS, CPA, and conversion volume to find optimization opportunities.
- Monthly & Quarterly Reports (The Strategic Deep Dive): Focus on big-picture trends to inform your next strategic moves. Answer questions about budget reallocation and new opportunities.
This tiered approach catches urgent issues without getting lost in the details. It also carves out dedicated time for strategic thinking. To learn more about data accuracy, see this article on why GA4 might under-report traffic.
Turning SEM Data Into Strategic Actions
Data is only valuable when it leads to a smart decision. Your SEM reporting dashboard is a goldmine of insights. You must know how to read the story behind the numbers.
A great report answers critical business questions. It tells you which campaigns drive growth and where to invest your next dollar. This moves you from reporting what happened to explaining why and deciding what’s next.
This shift from reporting to analysis separates average marketers from strategic ones.
Diagnosing Performance and Finding Opportunities
Diagnose performance issues before they become major problems. A sudden drop in conversion rate is a signal. It could mean a broken landing page or new competitor activity.
Spotting hidden opportunities requires a curious mindset. A high Click-Through Rate (CTR) but low conversions might indicate a disconnect between your ad and landing page. For more on this, learn how to find competitors of a website.
The most powerful insights often come from spotting anomalies in the data. Look for the outliers and dig in to find out why.
A Framework for Actionable Analysis
Use a simple framework for consistent analysis. For every key metric that changes, ask three questions:
- What changed? (e.g., ROAS dropped by 20% week-over-week.)
- Why did it change? (e.g., A top campaign hit its budget cap.)
- What is our next move? (e.g., Increase the budget and pause an underperforming campaign.)
This approach transforms reporting into an engine for continuous improvement. It ensures every data point is tied to a potential action.
Common SEM Scenarios and Your Next Move
Interpreting trends quickly is a key skill. This table turns common data points in your search engine marketing reporting into immediate actions.
| If You See This Trend | It Could Mean | Here Is What to Do Next |
|---|---|---|
| Rising CPA | Your ad costs are increasing, or your conversion rate is dropping. | Review keyword bids, check for new competitor activity, and A/B test your landing page. |
| High CTR, Low Conversion Rate | Your ad is compelling, but the landing page isn’t delivering. | Ensure your landing page message matches the ad copy. Simplify the conversion process. |
| Declining Impressions | Your ads show less often due to budget limits, low bids, or poor Quality Score. | Check daily budget pacing. Increase bids on high-intent keywords or improve ad relevance. |
| High ROAS in One Campaign | You’ve found a highly profitable combination of keywords, ads, and audience. | Protect and scale this campaign. Increase its budget and look for ways to replicate its success. |
By applying this analytical lens, your SEM reporting becomes a roadmap for the future.
Got Questions About SEM Reporting? We’ve Got Answers.
SEM reporting can feel like a moving target. New challenges pop up constantly. Here are straight answers to common questions from marketers.
What Is The Most Important Metric In SEM Reporting?
The answer is: it depends on your business. A KPI is only valuable if it measures progress toward your business goals.
For an e-commerce brand, it’s almost always Return On Ad Spend (ROAS). For a B2B SaaS company, it’s likely Customer Acquisition Cost (CAC) or Marketing Qualified Leads (MQLs).
Your primary KPIs should connect to the financial health of the business. Secondary metrics like Click-Through Rate (CTR) are diagnostic tools. They help explain why your main KPIs are changing.
How Often Should I Share SEM Reports?
Over-reporting is a common mistake. The right cadence matches the report to the audience.
- Executives (Monthly/Quarterly): They need the high-level view. Focus on ROAS, CAC, and revenue impact.
- Marketing Leadership (Weekly): Dig into trends here. Highlight wins, losses, and opportunities.
- Campaign Managers (Daily): This is a quick, tactical check on budget pacing and red flags.
The goal is to align the data with the recipient’s job. Your CEO cares about the investment’s return, not an ad group’s CTR.
How Do I Report On Campaigns With No Clicks, Like AI Overviews?
This is a critical new question. As features like Google’s AI Overviews become common, clicks are no longer the only sign of impact. The game is shifting to owning mindshare in AI-powered answer engines.
Here is how you can measure what you can’t click:
- Measure Share of Voice in AI Answers: How often does your brand get mentioned for key queries compared to competitors?
- Track Source Attribution: Are your blog posts and landing pages cited as sources? This signals content authority.
- Analyze Sentiment: Is the context positive when your brand is mentioned? This provides insight into brand perception.
This is about measuring influence at the top of the funnel. Being a trusted resource in AI answers is a powerful leading indicator of future business.
At Airefs, we help you measure and influence how your brand appears in AI-generated answers. See how you can track your visibility inside ChatGPT and Google AI Overviews to turn AI into a primary acquisition channel. Learn more at https://getairefs.com.
Frequently Asked Questions
What is the most important KPI for search engine marketing reporting? There is no single “best” KPI; it depends on your business goal. For e-commerce, it’s typically Return On Ad Spend (ROAS). For B2B lead generation, it’s usually Cost Per Acquisition (CPA) or lead quality.
How do I connect SEM metrics to actual sales data? Integrate your ad platforms (like Google Ads) with your CRM (like Salesforce). This connection is crucial. It lets you track a user from their first click to a closed deal, tying real revenue back to specific campaigns and keywords.
Should I report on vanity metrics like impressions and CTR? Yes, but only as diagnostic metrics, not as the headline result. A low Click-Through Rate (CTR) can help diagnose why an ad is underperforming. However, it won’t tell your CEO if the campaign was profitable.
How often should I send SEM reports to stakeholders? Match the frequency to the stakeholder’s role. An executive likely needs a high-level monthly or quarterly report. A hands-on marketing manager will benefit more from a concise weekly performance summary.
What is the best tool for building an SEM dashboard? For most users, Looker Studio is an excellent free starting point. For complex needs involving multiple data sources (like your CRM or social platforms), consider investing in a more advanced BI tool like Tableau or Power BI.