
Overview
A historical view of your mention rate across all tracked prompts, compared to competitors over time.
Share of voice is the core metric in Airefs: how often your brand is mentioned or cited across the prompts you track, compared to every competitor you’re monitoring. The Overview page is where you check it — stat cards, a trend chart, a rank leaderboard, and the history behind them.
The Overview is populated once your prompts have completed a scheduled run. Prompts run once per day by default — data appears the morning after your first run.
Stat cards and the trend chart
Across the top, five stat cards summarize where you stand right now: mention rate, rank in mentions, citation rate, rank in citations, and how many prompts are tracked — each compared against the previous period.
Below the cards, the main chart plots your mention rate over time against every tracked competitor. Each data point is a daily snapshot — the percentage of prompts where your brand appeared in the AI response — for whichever date range you’ve selected (7, 30, 90, or 180 days, or a custom range).
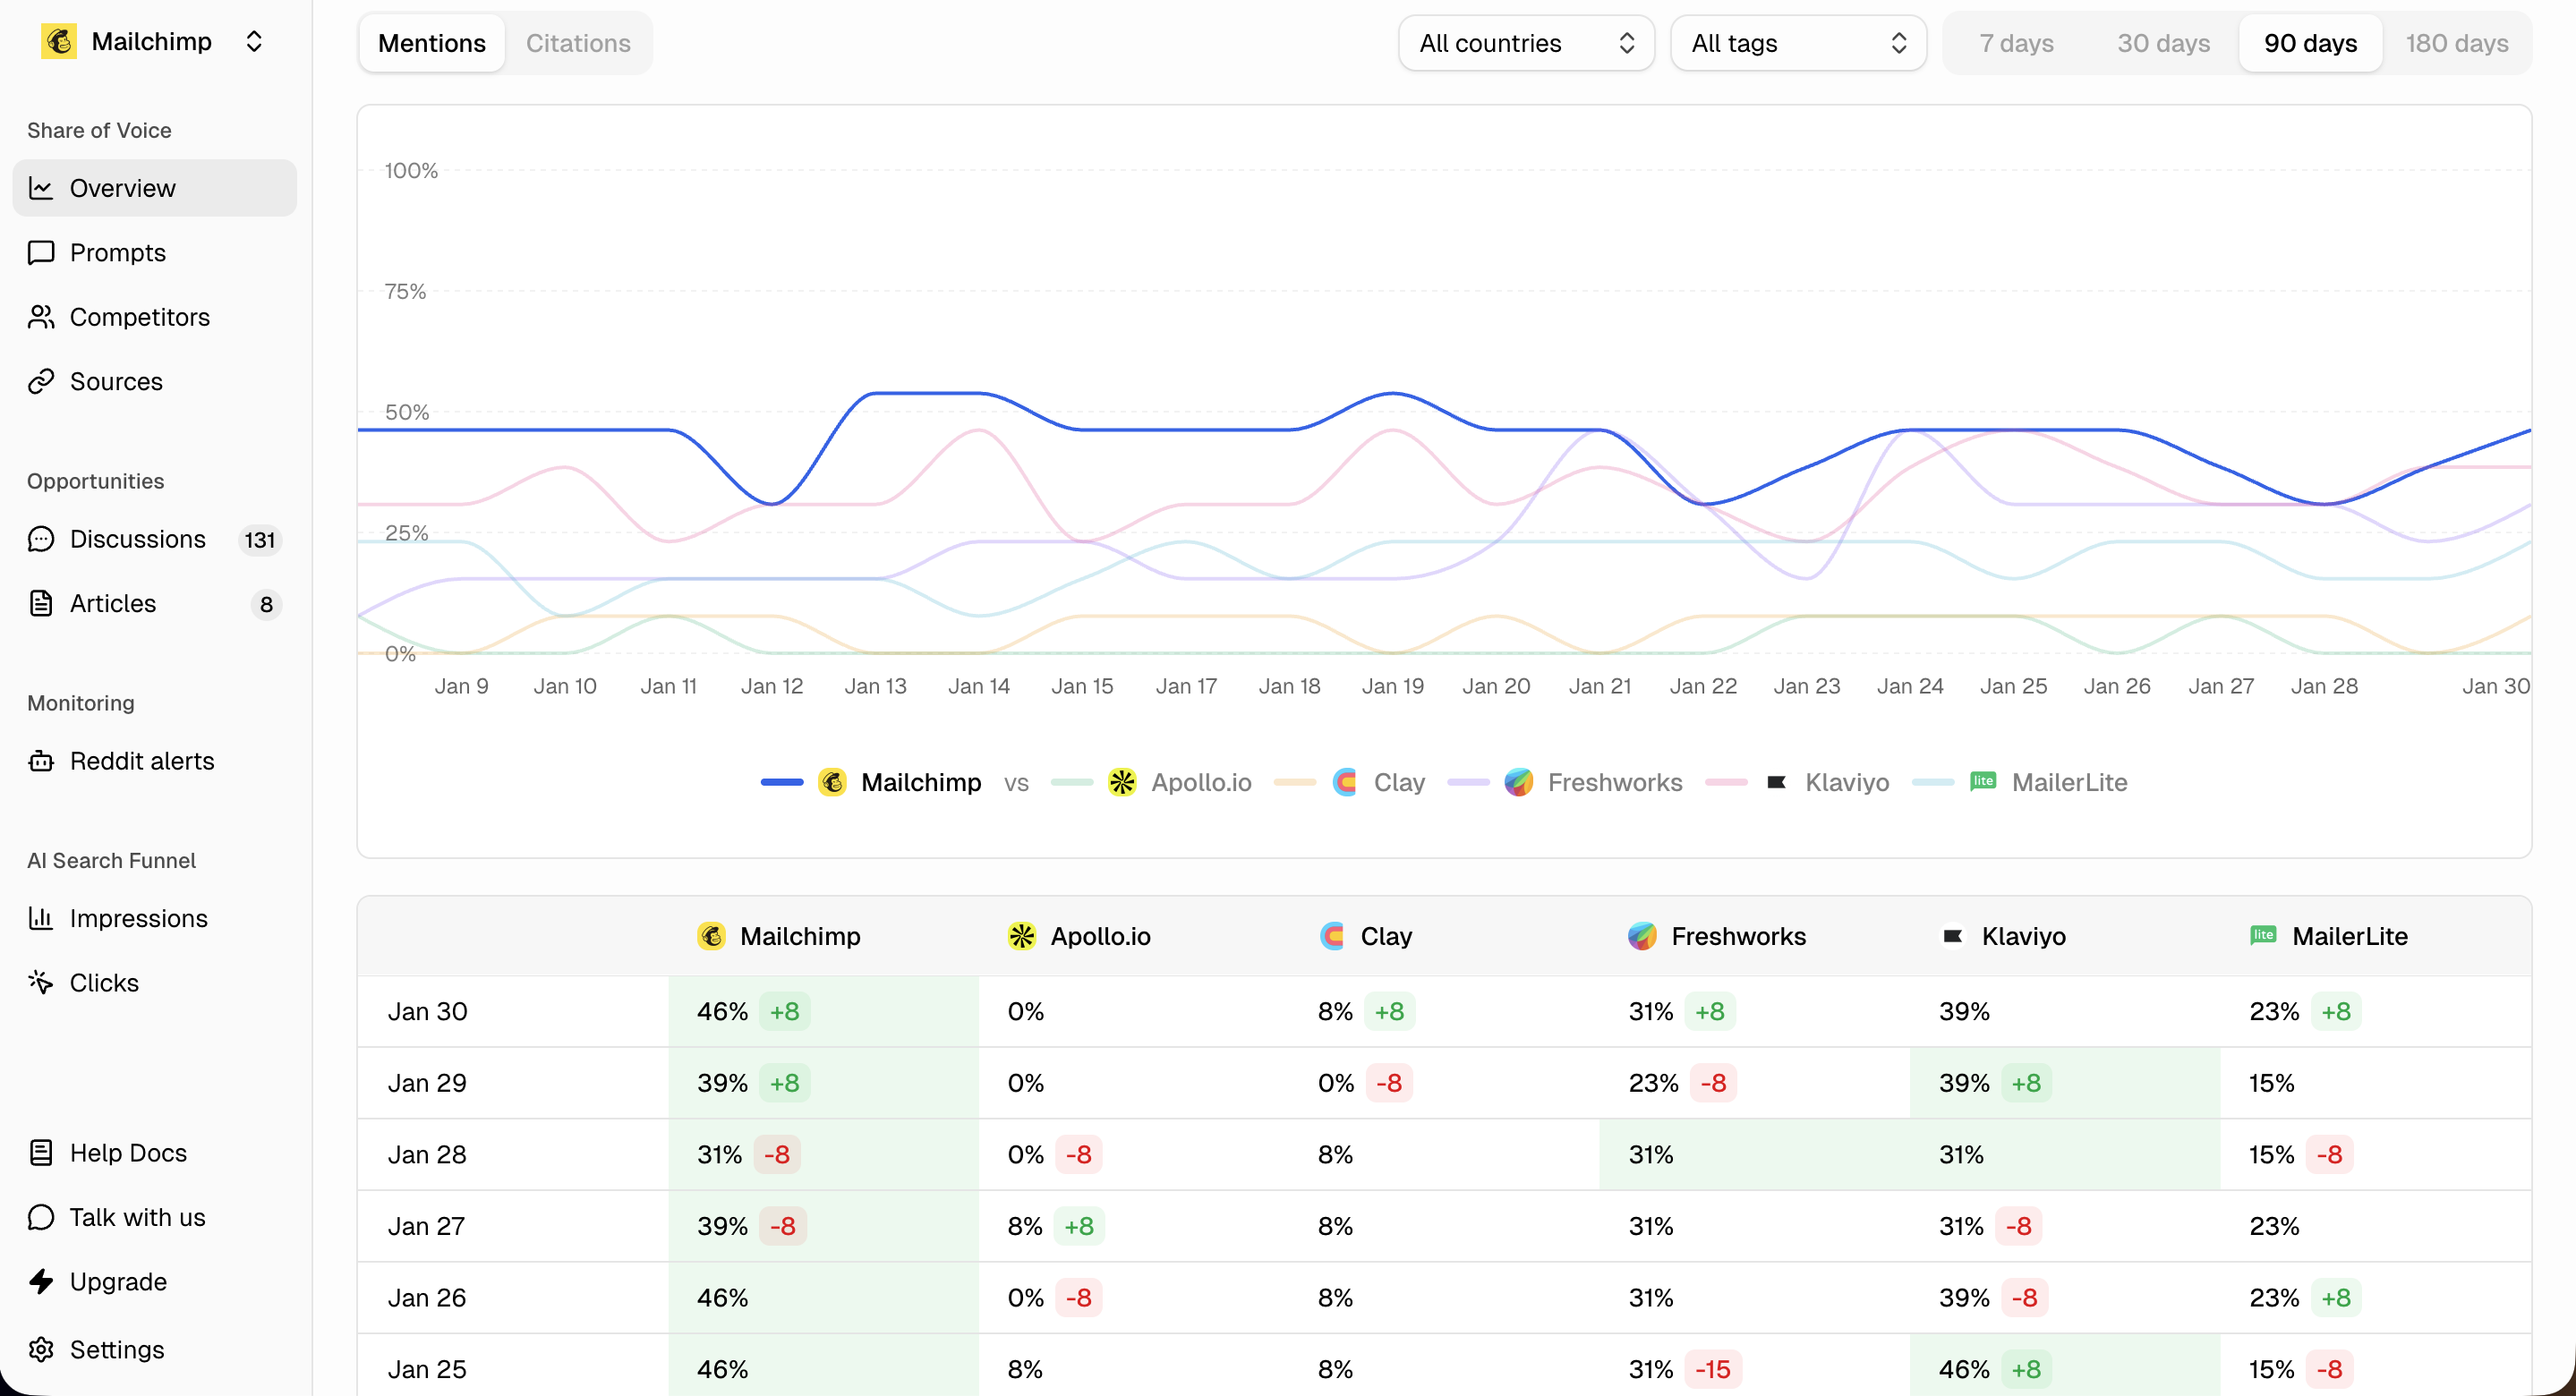
Use the platform toggle to switch between ChatGPT and Google, and the Mentions / Citations toggle to switch what’s being measured — this drives the stat cards, the chart, and the rank table together.
For most teams, the first surprise is seeing how invisible they are in queries where competitors appear regularly. Those competitors rank because specific articles and Reddit threads influence the AI’s answers — content that can be identified and displaced with the right effort.
Rank leaderboard
Beside the chart, a rank table lists every tracked brand by its current rate, with the change versus the previous period next to it. Your own brand is tagged You and highlighted so you can find your rank at a glance.
Mentions show who the AI recommends. Citations show whose content the AI trusts. High citations with low mentions means content influence without top placement. High mentions with low citations means brand recognition without sourcing authority. Both gaps point to different fixes.
Movers, prompt coverage, and run history
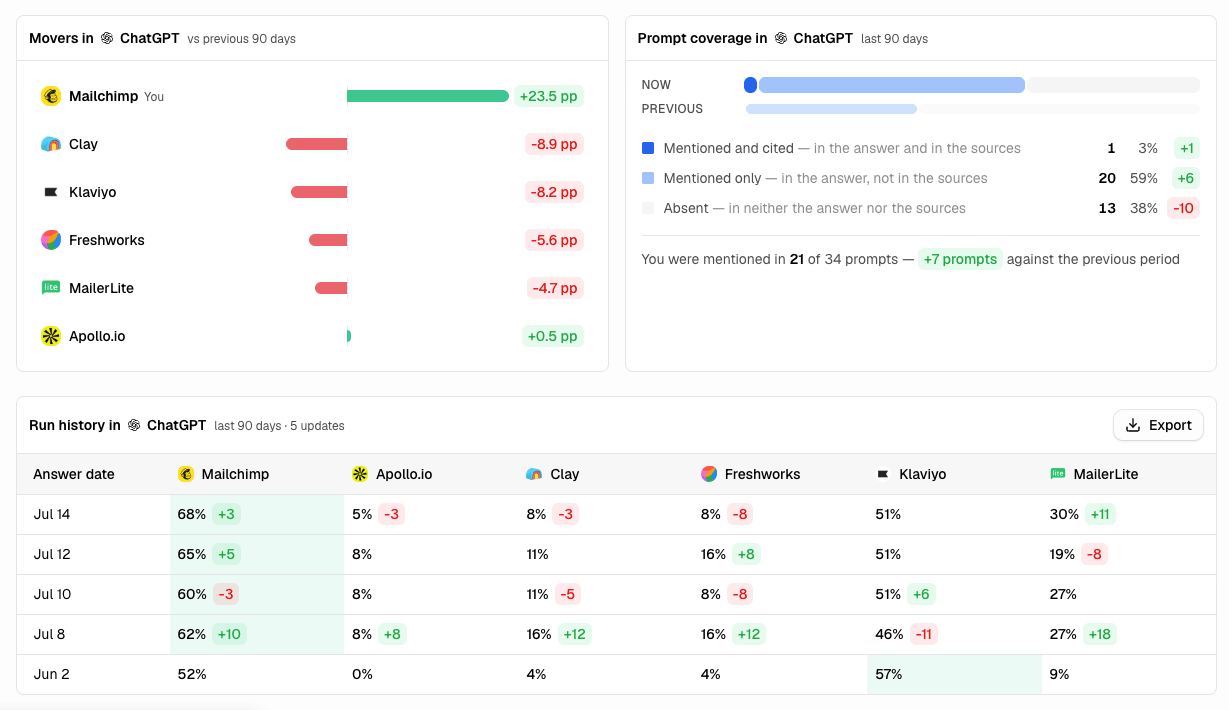
Below the chart, three panels break the trend down further.
Movers ranks every tracked brand by how much its rate moved versus the previous period — the biggest gainers and the steepest drops in one sorted list, so you can see at a glance who’s pulling ahead and who’s falling behind.
Prompt coverage splits your tracked prompts into three buckets: mentioned and cited (you’re in the answer and in the sources), mentioned only (you’re in the answer but not sourced), and absent (neither). A now-vs-previous comparison shows whether that mix is improving.
Run history is the raw log behind the chart — every scheduled answer, with each tracked brand’s rate on that date and how it moved from the prior run. Export it to CSV for reporting or deeper analysis outside Airefs.
Filters
Use the tag filter to isolate a specific topic cluster — for example, to separate category winner prompts from informational ones. Use the country filter to see a specific market. Change the date range to compare periods before and after publishing a new piece of content or joining a thread.
Reading trends
The Overview is your check-in view. An upward trend in mention rate confirms that your AEO work — content published, discussions joined, Reddit threads engaged — is having an effect. A flat or declining line is a signal to dig deeper.
If your mention rate drops, check the Sources page to see if any highly-cited URLs changed. Also check the Prompts page to identify which queries drove the decline.
Filter by tag to separate the signal. If category winner prompts are declining but informational ones are flat, the problem is positioning — not content discovery.